The downloadable PDFs contain no browser-added date, time or website address. When printing this webpage in Chrome or Edge, open More settings and turn off Headers and footers.
Artwork is symbolic teaching illustration, not an archival photograph or a reconstruction of a named place. Dates, labels and explanations remain in the text. Print controls prepare the selected document's images and fonts before opening the print dialog.
Lives → priorities
Start with the constraint
Rain-dependent farmer
Unreliable water
may prioritise→
Dependable irrigation
Unemployed young person
Uncertain livelihood
may prioritise→
Secure work
Girl in a prosperous family
Unequal opportunities
may prioritise→
Freedom to choose studies
Ask people what matters. A life situation helps explain a goal without fixing every aspiration.
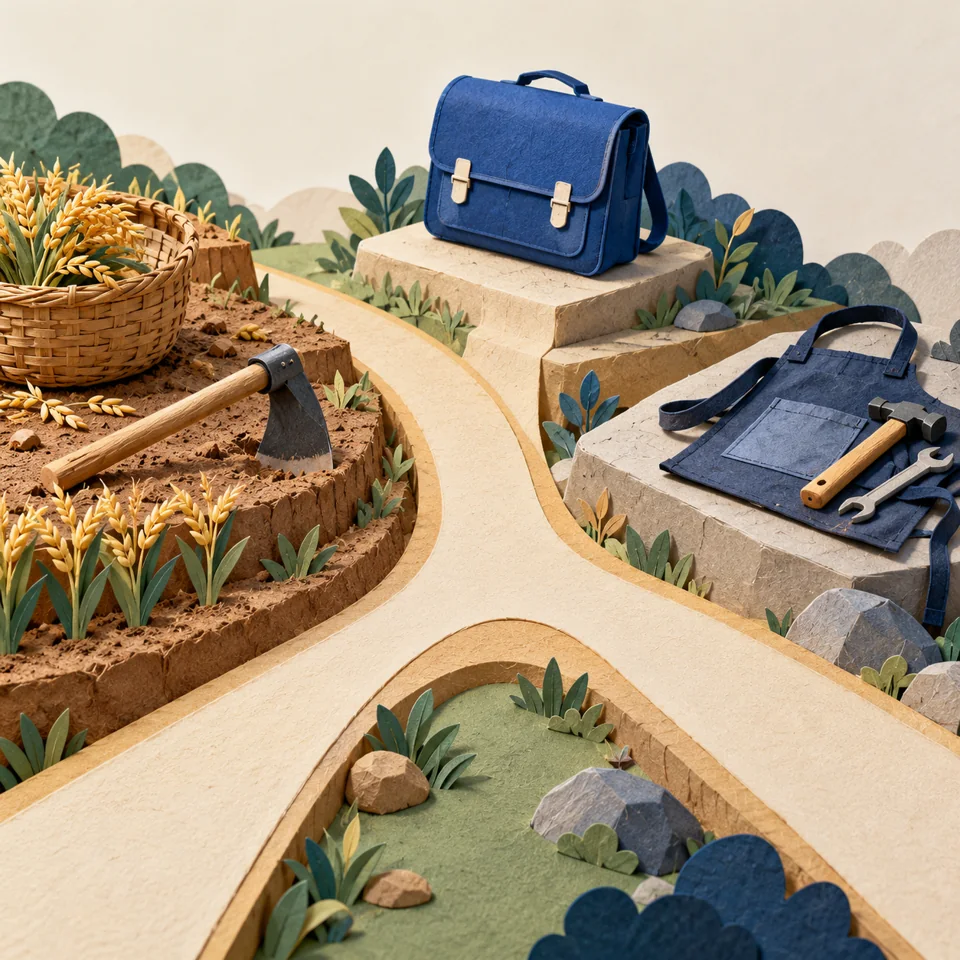
Tools, a school satchel and a work apron suggest different life situations. Symbolic objects, not fixed identities or a survey.
1Start with a situation, not a stereotype
Development: A process of improving how people can live. Ask what people need, what they value and how change could make life better.
A landless labourer may seek more workdays, better wages, a good school and freedom from discrimination. A rain-dependent farmer may prioritise dependable water. An unemployed young person may seek a secure job and opportunities to learn.
A prosperous farmer's income goal can coexist with a wish to educate children. A girl in a rich family may still seek equal freedom and a voice in her own future. Wealth does not remove every barrier.
Life situation helps explain priorities, but a category does not tell us everything a person wants. Listen to the person's own account; the textbook's partly completed goals table invites discussion rather than one answer for every identity.
2Different does not always mean conflicting
Pair of goals
Relationship under the stated conditions
A school library and a reliable village water supply
Different goals that may support each other; a shared budget could still create a trade-off.
A worker seeks higher wages; an employer seeks lower labour costs
Potential conflict over the same payment, even if both value stable production.
A student seeks equal study time; a sibling expects her to do all housework
A conflict about freedom and how work is shared.
3A useful question
Ask whose starting conditions, opportunities and constraints explain a goal. Do not assume every difference is a conflict or that every demand benefits everyone. Development is open to reasoned debate.
Include children and other non-workers. Do not divide by workers or households.
Fictional annual example: P, Rs 12,00,000 ÷ 100 = Rs 12,000 per person. Q, Rs 9,00,000 ÷ 50 = Rs 18,000. A larger total need not give a larger mean.
Match year, currency, period and price basis. World Bank grouping uses Atlas GNI/person; PPP income has a different basis. Historical cutoffs are not current rules.
Check every indicator's unit, denominator, age group, year and desirable direction.
Income helps people buy goods+Public facilities make opportunities usable+Resource limits protect future possibilities
6. Public facilities and outcomes
Historical comparison
Haryana / Kerala / Bihar
Income Rs/person/year, 2023-24
3,25,759 / 2,81,001 / 60,337
IMR per 1,000 live births, 2020
28 / 6 / 27
Literacy %, ages 7+, 2017-18
82 / 94 / 62
Attendance %, ages 15 to 17, 2017-18
73 / 94 / 69
Lower IMR is favourable; higher literacy and attendance are favourable. Income gives a partial comparison. These different-year observations do not prove a cause.
Usable schools, healthcare, safe water and food support need reliable operation, quality and access as well as money.
Rural UP, ages 10 to 14: girls absent 18%, not literate 13%. Attendance and literacy differ; the table gives no year.
UNDP combines health, education and income. Life expectancy is an average, not a guarantee; mean schooling here covers adults aged 25+.
2023 data, HDR 2025: India and Bangladesh share rank 130/193, but life expectancy is 72.0 and 74.7 years. Nepal's 70.4 is below India's.
A smaller rank number means a higher position. Rank does not reveal every inequality or every person's experience. PPP income compares purchasing power.
Maintain conditions for future generations to live well. Renewable groundwater can decline when use exceeds recharge.
Fictional annual balance: 80 recharge - 110 extraction = 30 units lost. Storage alone does not show quality or access.
Oil is finite on human timescales. Discovery increases known reserves, not natural renewal.
Historical world oil reserves: 1,732 thousand million barrels in 2017; 47 years at the assumed rate. This is conditional, not a countdown from today. Imports bring price and supply risks.
Connect goals, distribution, usable services, evidence and environmental limits. State a trade-off, an uncertainty and a measurable check.
NFHS-5 2019-21, low-BMI adults aged 15 to 49: Kerala males/females 8.5%/10%; Madhya Pradesh 28%/28%. These are population data, not labels for classmates.
Enough food overall does not ensure household access. Investigate affordability, distribution, health and services; a comparison alone does not prove why groups differ.
This format has not been prepared yet. Browser-menu printing uses text first, without blank illustration slots. For the prepared version, cancel and use the labelled Print notes control.
Study AnimatesClass 10 / Economics
Development: Detailed notes
Visual notebook. Artwork is symbolic teaching illustration.
Development
1. Different lives, different goals
Different starting conditions help explain different goals, without fixing one aspiration for every identity.
Lives → priorities
Start with the constraint
Rain-dependent farmer
Unreliable water
may prioritise→
Dependable irrigation
Unemployed young person
Uncertain livelihood
may prioritise→
Secure work
Girl in a prosperous family
Unequal opportunities
may prioritise→
Freedom to choose studies
Ask people what matters. A life situation helps explain a goal without fixing every aspiration.
Tools, a school satchel and a work apron suggest different life situations. Symbolic objects, not fixed identities or a survey.
1Start with a situation, not a stereotype
Development: A process of improving how people can live. Ask what people need, what they value and how change could make life better.
A landless labourer may seek more workdays, better wages, a good school and freedom from discrimination. A rain-dependent farmer may prioritise dependable water. An unemployed young person may seek a secure job and opportunities to learn.
A prosperous farmer's income goal can coexist with a wish to educate children. A girl in a rich family may still seek equal freedom and a voice in her own future. Wealth does not remove every barrier.
Life situation helps explain priorities, but a category does not tell us everything a person wants. Listen to the person's own account; the textbook's partly completed goals table invites discussion rather than one answer for every identity.
2Different does not always mean conflicting
Pair of goals
Relationship under the stated conditions
A school library and a reliable village water supply
Different goals that may support each other; a shared budget could still create a trade-off.
A worker seeks higher wages; an employer seeks lower labour costs
Potential conflict over the same payment, even if both value stable production.
A student seeks equal study time; a sibling expects her to do all housework
A conflict about freedom and how work is shared.
3A useful question
Ask whose starting conditions, opportunities and constraints explain a goal. Do not assume every difference is a conflict or that every demand benefits everyone. Development is open to reasoned debate.
Development
2. Income, dignity and security
A better life involves income alongside dignity, security, freedom and relationships.
A mix of goals
Compare the whole job
Job A
Rs 18,000 / month
Short contract Unpredictable hours
Job B
Rs 16,000 / month
Regular work Predictable hours
Fictional comparison. For both: investigate safety, travel costs and learning opportunities.
A defensible preference weighs pay, security and the person's needs. Neither job is automatically best for everyone.
Earnings and a sheltered living space share one floor. Symbolic income and security, without ranking personal preferences.
1People usually seek a mix
Material goals: Regular work, wages, crop prices and goods that support living. Income expands what a household can buy and is a useful part of development.
Non-material goals: Equal treatment, dignity, freedom, safety, security, friendship and respect. Difficulty measuring them does not make them unimportant.
A higher-paid job may involve insecure employment, unsafe conditions or little family time. A lower-paid job may provide dependable work or learning opportunities. Compare the whole situation before judging a choice.
Paid work can support women's dignity and independence. Respect, shared household work and safe public spaces also affect whether women can take up work or run a business. One change does not automatically remove every constraint.
2Explain a preference fairly
There is no automatically correct personal choice between these jobs. A defensible answer states the person's needs, weighs pay against conditions and identifies missing evidence. Income and dignity are connected, rather than two completely separate worlds.
Development
3. Whose development ?
A public judgement must investigate benefits, costs, alternatives and the voices of affected people.
Private gain → public judgement
One project, different consequences
Possible gains
Electricity for industry Irrigation for farms
Possible costs
Submerged land Displaced homes and livelihoods
Ask who receives each gain or bears each cost, then compare feasible alternatives.
A benefit to one group does not cancel another group's loss. Compare alternatives and safeguards.
A river-valley proposal connects power, farming and nearby homes. Symbolic competing uses, not the Narmada Valley or a factual map.
1Who gains, who bears the cost
A dam may provide electricity for industry and irrigation. It may also submerge land, displace communities and damage livelihoods. People who oppose a proposal may seek a different kind of development, rather than oppose every improvement.
NCERT's Narmada example contrasts a large dam with smaller check dams or tanks preferred by some affected people. An alternative must still be tested for actual water, energy and livelihood needs.
National development: Judging a path for society: whose needs count, whether benefits reach many people, whether costs are fair and whether there is a better way. It is more than adding one group's profits.
The chapter's historical Abidjan waste report shows how a disposal transaction can shift serious health costs onto others. Financial savings for a company do not establish improvement for the affected community. Do not treat the report's old casualty figures as current news.
2Build a fair public comparison
Listen
Identify affected groups and their goals.
guides
Compare
Investigate benefits, losses and alternatives.
supports
Judge
Give reasons, protections and checks.
Consultation informs judgement but does not guarantee agreement. A majority benefit does not make every harm irrelevant.
3Keep values visible
Policy choices can involve reasonable competing priorities. State your assumptions and explain how affected people participate, how unavoidable losses are addressed and what evidence could change your recommendation.
Development
4. Income per person
Per capita income compares income per person, using the whole population and a common period.
Worked fictional annual comparison
A bigger total can give a smaller average
Per capita income=Total income ÷ Total population
Country P
Rs 12,00,000 ÷ 100 people
Rs 12,000per person per year
Country Q
Rs 9,00,000 ÷ 50 people
Rs 18,000per person per year
Q has less total income but more income per person. Neither average tells us how that income is shared.
Resource baskets and receiving cups suggest division by population. Symbolic quantities, not a numerical dataset.
1Total and average answer different questions
Total income: The combined income of residents over a stated period in the chapter's simplified comparison. A larger population can produce a larger total without a higher income per person.
Per capita income: Total income ÷ total population. Per capita means per person. Include every resident in the denominator, not only workers, taxpayers or families.
Keep currency, period and price basis comparable. Monthly and annual values cannot be compared directly. A mean is a calculation, not a promise that every resident receives that amount.
2Use a classification carefully
P has the larger total; Q has the larger average. This tells us about income per person, not which country has better health, equal rights or a sustainable resource path.
The World Bank's income grouping uses GNI per capita with the Atlas conversion method and a specified year. PPP dollars, used in the later human-development table, are a different comparison basis.
The textbook's 2024 classification paragraph mixes figures that do not match the official Atlas classification method. Learn the criterion and its limitations; do not treat those quoted thresholds as current or directly comparable with PPP income.
4An income measure is useful but partial
Income helps explain access to goods. It does not reveal distribution, service quality, discrimination or environmental costs. Add evidence rather than discarding the measure entirely.
Development
5. Averages and distribution
An average can help comparison while concealing how resources are distributed.
Textbook's fictional five-citizen countries
Equal means, unequal shares
Country A
Rs 50,000 total each month
I9,500
II10,500
III9,800
IV10,000
V10,200
Citizen I to V, monthly income in Rs. Bar width shows share of the total.
Country B
Rs 50,000 total each month
I500
II500
III500
IV500
V48,000
Citizen I to V, monthly income in Rs. Bar width shows share of the total.
Each mean is Rs 10,000 per person per month. In B, one citizen receives 96% of total income.
Two trays spread resources differently. Symbolic distribution; the exact five-citizen values are selectable text below.
1Read the textbook's five-citizen example
Country A: 9,500 + 10,500 + 9,800 + 10,000 + 10,200 = Rs 50,000 per month. Country B: 500 + 500 + 500 + 500 + 48,000 = Rs 50,000 per month.
For each, Rs 50,000 ÷ 5 citizens = Rs 10,000 per person per month. The equal means conceal a much more concentrated distribution in B.
In B, four of five citizens receive Rs 500 each. The fifth receives Rs 48,000, or 96% of total income. In A, all five lie close to the mean. These are fictional countries used by the textbook, not national statistics.
2Monthly incomes in rupees, textbook Table 1.2
Citizen
Country A
Country B
I
9,500
500
II
10,500
500
III
9,800
500
IV
10,000
500
V
10,200
48,000
Mean
10,000
10,000
3Why a rising average is not enough
One income rises
Others may remain unchanged.
raises
The total rises
Population can stay fixed.
raises
The mean rises
Some residents need not gain.
A fictional change from [100, 100, 100, 100] to [100, 100, 100, 500] doubles the mean from 100 to 200 while three incomes do not change.
4The conclusion the evidence supports
A is more equal in this example. Equal means do not establish equal living conditions. These income lists alone do not establish health, freedom or environmental sustainability, and cannot prove why an unequal distribution arose.
Development
6. Public facilities and outcomes
Usable public facilities connect resources with health, education and opportunities.
Historical State evidence
Income and health can tell different stories
Annual income per person
Rs, 2023-24; higher means more income
Haryana
3,25,759
Kerala
2,81,001
Infant mortality
Deaths before age 1 per 1,000 live births, 2020; lower is better
Haryana
28
Kerala
6
Kerala's lower listed income coexists with lower infant mortality. Different years and other influences prevent a causal verdict.
Connected water, learning and basic-care spaces suggest collective provision. Symbolic facilities, not evidence of a particular State's services.
1Why private income cannot do everything
Clean surroundings, safe medicines, disease prevention, accessible schools and basic healthcare depend partly on collective arrangements. Buying one household a service may not protect it from polluted air or a community-wide infection.
Collective provision can share costs and reach people who cannot afford private alternatives. A school needs teachers, safe access and reliable operation as well as a building. Spending alone does not establish quality or equal access.
The Public Distribution System can support access to food. The textbook's historical ration-shop-use comparison suggests investigating reach, but use alone does not prove nutrition, quality or a causal effect. Check entitlement, supply, access and other conditions.
2Historical State comparison, Tables 1.3 and 1.4
State
Annual income Rs, 2023-24
IMR, 2020
Literacy %, 2017-18
Net attendance %, 2017-18
Haryana
3,25,759
28
82
73
Kerala
2,81,001
6
94
94
Bihar
60,337
27
62
69
3Read every indicator with its denominator
Income: Per capita Net State Domestic Product at current prices, used here as the State income comparison. Higher income alone does not establish better outcomes in every field.
IMR: Deaths before the first birthday per 1,000 live births in the stated year. Lower is desirable. Haryana's 28 versus Kerala's 6 is a difference of 22 per 1,000 and about 4.7 times as high.
Literacy: Literate people as a percentage of the population aged 7 and above. Higher is desirable; it is not the same as school attendance.
Net attendance: The table's secondary-stage attendance measure for ages 15 to 17 per 100 people of that age. Higher is desirable. Bihar's 69 means 31 per 100 are outside that measured attendance, not 31% of all residents.
Kerala has lower income than Haryana in the listed year but lower IMR and higher literacy and attendance in their listed years. This challenges income-only judgement. Different years and unobserved factors prevent a simple causal claim.
4Rural Uttar Pradesh, textbook Table 1.5 (year not stated)
Measure
Male %
Female %
Literacy, rural population
76
54
Literacy, rural children aged 10 to 14
90
87
Attendance, rural children aged 10 to 14
85
82
5Work out the complements without mixing measures
Not attending: 100 - 85 = 15% of boys and 100 - 82 = 18% of girls aged 10 to 14. Not literate in that age group: 10% of boys and 13% of girls. Attendance and literacy are different: a literate child may be absent from school. The table's broader population literacy rates are not attendance rates.
Development
7. Human development
Human development compares selected outcomes in people's lives, while retaining the limits of each measure.
Human development
Three dimensions, a qualified comparison
Health
Life expectancy
Average years expected at birth; not a personal guarantee.
Education
Schooling
Mean completed adult schooling and expected schooling contribute to HDI.
Income
GNI per person
Purchasing-power comparison; not equal cash paid to everyone.
2023 data, HDR 2025: India life expectancy 72.0 years; Bangladesh 74.7; Nepal 70.4. Compare the values, then qualify the claim.
The index combines selected achievements. A shared rank does not mean identical lives or an equal distribution.
A learning space, care objects and a livelihood basket share a balanced foundation. Symbolic capabilities, not an index calculation.
1Broaden the question
UNDP's Human Development Report brings health and education into comparison alongside income. The purpose is to examine people's lives, rather than assume income captures every outcome.
Life expectancy at birth: The average expected years of life for a newborn under the mortality conditions represented by the measure. It is not an individual's guaranteed lifespan.
Mean years of schooling: Average completed schooling among adults aged 25 and above in this table. It is neither current child attendance nor the percentage of literate adults.
PPP income: GNI per person expressed in 2021 purchasing-power-parity dollars to account for differences in what money buys. It is not a cash payment in US dollars or the Atlas income classification measure.
HDI rank: A relative position among 193 countries in this report. A smaller number is a higher position. HDI's education dimension includes expected years of schooling as well as adult mean schooling; the chapter table does not show every input. The index does not capture all wellbeing or every person's life.
22023 data reported in Human Development Report 2025
Country
GNI/person, 2021 PPP $
Life expectancy, years
Mean schooling, age 25+, years
HDI rank / 193
Sri Lanka
12,616
77.5
10.8
89
India
9,047
72.0
6.9
130
Myanmar
4,919
66.9
6.4
150
Pakistan
5,501
67.6
4.3
168
Nepal
4,726
70.4
4.5
145
Bangladesh
8,498
74.7
6.8
130
3Compare within the evidence
Sri Lanka is ahead of India on these listed indicators. That is a bounded comparison, not proof that every aspect of life is better.
Bangladesh has lower listed income than India but higher life expectancy, 74.7 versus 72.0 years. Nepal's 70.4 is below India's 72.0. Income and life expectancy need their own comparisons.
India and Bangladesh share rank 130 in this table despite different listed income, health and schooling values. A shared rank does not mean identical conditions. These are historical report data, not today's rankings.
Development
8. Can an improvement last ?
Present improvement must be tested against resource renewal, finite stocks and future needs.
Fictional annual groundwater balance
Renewal must keep up with use
80 unitsrecharge enters storage
−
110 unitsextraction leaves storage
=
30 units lostover one year, ignoring other flows
Renewable does not mean unlimited. Also investigate water quality, access and other flows.
A cutaway water store and a finite mineral seam suggest different resource limits. Symbolic geology, without a factual scale or flow rate.
1Stocks, renewal and use
Sustainable development: Improvement that can be maintained for future generations, rather than using up the conditions on which their lives depend.
Renewable resource: Nature can replenish it, but use may exceed renewal. Groundwater can decline when extraction is greater than recharge from rain over time.
Non-renewable resource: A finite resource such as crude oil, not replenished on a human timescale. Discoveries can increase known reserves without making the resource renewable.
A fictional aquifer gaining 80 units and losing 110 units over a year loses 30 units of stored water. Rainfall alone does not prove safe use. Check actual recharge, extraction, water quality and access.
2Historical crude-oil estimate, Table 1.7
Region
Reserves in 2017, thousand million barrels
Years at the assumed extraction rate
Middle East
836
70
United States of America
69
10.5
World
1,732
47
3A conditional estimate is not a countdown
These are the supplied table's historical values, cited to a 2024 statistical review. The years depend on the assumed extraction rate and known reserves. They are not a present forecast or a calendar date when all oil must disappear.
Oil imports expose India to price rises and supply risks. Reducing avoidable demand and investigating alternatives can reduce dependence, but an alternative also has resource, infrastructure and affordability costs.
The chapter's groundwater warning names agricultural regions, hard-rock areas, coasts and growing towns. Its undated 'another 25 years' warning cannot be restarted today. The durable idea is the balance between use and replenishment.
4Think across people, places and time
Environmental damage can cross State and national boundaries. Judge present livelihoods, unequal access and future resource security together. A project called green still needs evidence about its actual impacts and who bears its costs.
Development
9. Make a reasoned judgement
A defensible judgement connects people's goals, distribution, capabilities, evidence and environmental limits.
A defensible judgement
Follow a promise through to people's lives
PeopleWhose goals, gains and losses?
EvidenceWhich measure, unit and year?
OptionsWhich benefits, costs and limits?
JudgementWhich conditions and checks?
Recommend a path with reasons, a trade-off and checks that could change your conclusion.
A community planning surface connects livelihoods, services and a protected landscape. Symbolic evaluation, not a complete district plan.
1Connect five questions
Goals: What do affected people seek, and which goals conflict ? Include dignity and voice alongside earnings.
Distribution: Who gets the jobs, income and services ? A rise in the average may conceal unchanged or worsening lives.
Public capability: Can people actually use good schools, healthcare, safe water and food support ? Spending or construction alone does not prove access.
Evidence: What is the indicator's unit, denominator, age group and year ? Does it support a comparison, a cause or only a possible explanation ?
Environmental limits: Will extraction, pollution and future costs undermine the gain ? Compare feasible alternatives and name a way to monitor results.
2Historical low-BMI adult shares, NFHS-5 2019-21
State / group
Male %
Female %
Kerala
8.5
10
Karnataka
17
21
Madhya Pradesh
28
28
All States
20
23
3Food availability is not the same as food access
This table concerns adults aged 15 to 49 with BMI below 18.5 kg/m². It is a historical population comparison, not a method for assessing Class 10 students. A lower share is favourable for this particular measure; it does not prove every aspect of nutrition is good.
Madhya Pradesh has larger low-BMI shares than Kerala for both listed groups. Enough food in aggregate does not ensure households can afford, obtain or use it. Income, distribution, health and public provision are possible pathways to investigate, not causes proved by this table alone.
For a fictional factory proposal, compare jobs and wages with access to services, displaced livelihoods, water demand and pollution. Recommend conditions and measurable checks, such as reliable water access for affected households, rather than promise universal benefit.
Income per person=Total income ÷ All residentsSame currency and period. A mean does not show distribution.
1. Different goals, possible conflicts
Life situations shape priorities: work, water, education, freedom and dignity. Listen instead of assigning one goal to an identity.
Different goals may coexist. They conflict when one obstructs another: higher wages versus lower costs for the same wage payment.
2. A mix of goals
Income buys useful goods; respect, security, safety, equal treatment and family time also matter.
Compare pay with conditions and the person's needs. A lower-paid job can be preferable without making income irrelevant.
3. From private gain to public judgement
A dam may provide power while displacing people. Ask who gains, who loses and whether a feasible alternative is fairer.
Company profit does not include every cost to residents. Participation, safeguards and actual outcomes matter.
4. Use the whole population
Include children and other non-workers. Do not divide by workers or households.
Fictional annual example: P, Rs 12,00,000 ÷ 100 = Rs 12,000 per person. Q, Rs 9,00,000 ÷ 50 = Rs 18,000. A larger total need not give a larger mean.
Match year, currency, period and price basis. World Bank grouping uses Atlas GNI/person; PPP income has a different basis. Historical cutoffs are not current rules.
5. A mean hides the spread
Monthly incomes, Rs
Mean, Rs
A: 9,500; 10,500; 9,800; 10,000; 10,200
10,000
B: 500; 500; 500; 500; 48,000
10,000
Textbook fictional countries: both total Rs 50,000 across five citizens. In B one receives 96% of total income.
A rising mean can leave some incomes unchanged. Income lists do not establish health, freedom or sustainability.
Study AnimatesClass 10 / Economics
Development / Quick notes 2 / 2
Capabilities and a lasting future
Check every indicator's unit, denominator, age group, year and desirable direction.
Income helps people buy goods+Public facilities make opportunities usable+Resource limits protect future possibilities
6. Public facilities and outcomes
Historical comparison
Haryana / Kerala / Bihar
Income Rs/person/year, 2023-24
3,25,759 / 2,81,001 / 60,337
IMR per 1,000 live births, 2020
28 / 6 / 27
Literacy %, ages 7+, 2017-18
82 / 94 / 62
Attendance %, ages 15 to 17, 2017-18
73 / 94 / 69
Lower IMR is favourable; higher literacy and attendance are favourable. Income gives a partial comparison. These different-year observations do not prove a cause.
Usable schools, healthcare, safe water and food support need reliable operation, quality and access as well as money.
Rural UP, ages 10 to 14: girls absent 18%, not literate 13%. Attendance and literacy differ; the table gives no year.
7. Human development
UNDP combines health, education and income. Life expectancy is an average, not a guarantee; mean schooling here covers adults aged 25+.
2023 data, HDR 2025: India and Bangladesh share rank 130/193, but life expectancy is 72.0 and 74.7 years. Nepal's 70.4 is below India's.
A smaller rank number means a higher position. Rank does not reveal every inequality or every person's experience. PPP income compares purchasing power.
8. Sustainable development
Maintain conditions for future generations to live well. Renewable groundwater can decline when use exceeds recharge.
Fictional annual balance: 80 recharge - 110 extraction = 30 units lost. Storage alone does not show quality or access.
Oil is finite on human timescales. Discovery increases known reserves, not natural renewal.
Historical world oil reserves: 1,732 thousand million barrels in 2017; 47 years at the assumed rate. This is conditional, not a countdown from today. Imports bring price and supply risks.
9. Defend and review a judgement
Connect goals, distribution, usable services, evidence and environmental limits. State a trade-off, an uncertainty and a measurable check.
NFHS-5 2019-21, low-BMI adults aged 15 to 49: Kerala males/females 8.5%/10%; Madhya Pradesh 28%/28%. These are population data, not labels for classmates.
Enough food overall does not ensure household access. Investigate affordability, distribution, health and services; a comparison alone does not prove why groups differ.